RECOMMENDED READING:
How Instagram insights can help you:
Instagram insights can help you know these statistics about your posts, audience and your profile:
1. Which type of posts your audience loves
So that you can replicate such posts and gain more engagement. Instagram is all about getting engagement and building relationships – you know this by now, if you’ve been following me for a while.
2. At what time most of your audience (followers) is online
Posting at such times can boost your post at a higher level (Chances of going viral on Instagram). Instagram boosts the post’s impressions that gets higher amount of likes within the first hour of posting.
Watch going viral in Action: How to go viral on Instagram
3. Who is your audience
Their age groups, country, gender, etc. Knowing this will help you more about which type of content to post and what time to post for higher engagement.
For instance, if you audience belongs to 10-18 age group, then posting educative and funky stuffs will work, as your audience is mainly in school.
4. Where is your audience coming from
Is your audience coming from the hashtags, explore page, other accounts?
If your audience is coming from hashtags, you should use that hashtag more often to get more engagement.
5. Are your hashtags giving good results?
6. How is your bio working – Should you change it?
7. Which call-to-action works best for you?
RECOMMENDED READING:
How to use these analytics to improve your Instagram marketing:
I think by now you must be clear that analyzing this data and using it to your advantage can give you really good results.
So let’s break these down:
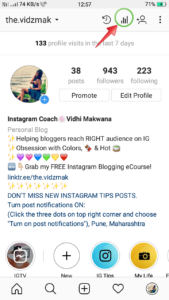
Go to your profile -> On the top right corner click on the third symbol (📊) from right.
1. Post Insights:
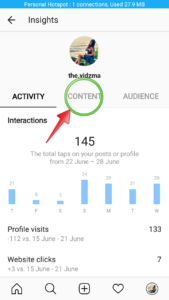
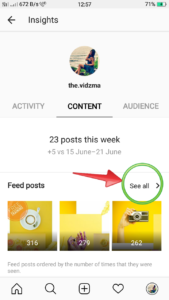
Click on the “Content” tab.
In the Feed Posts click “See All”:
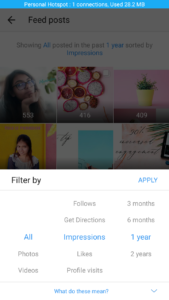
Here you can filter out these statistics. By default it is sorted by Impressions for last 1 year’s posts. Click on any of the blue words to filter.
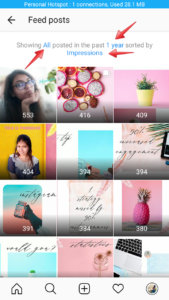
Filtering this in different ways lets you know different aspects about your posts:
1. 7 days and Engagement
I am using 7 days’ content here all the way in this article because you wanna use your most recent statistics to find out what’s working RIGHT NOW. But if you post very rarely, like once in a week, then you can go for a month’s content.
Engagement = Likes + Comments + Saves
Look at the highest rated post and figure out the difference in that than your other posts.
What to notice…
1⃣ What value does that post provide: education, information, inspiration, entertainment, or is it a product/service promotion.
2⃣ Caption voice: Which type of voice you used – humble, polite, sarcastic?
3⃣ Image: What is different in this image than others? Is it a selfie? If it a flatlay? Is it the color?
4⃣ What day and time you posted this?
5⃣ Are there many comments on this post? Which CTA you used to help encourage them to comment? Is there anything else that encouraged them?
All these factors combined and replicated in other post can get you the same kind of engagement.
2. 7 days and comments.
Use the same questions I used in the 4th point above and replicate that to get more comments.
3. 7 days and Follows.
Notice all the points I explained above to see why that post got you the most follows.
Did you use any CTA?
What did tone you use?
What time you posted?
4. 7 days and Impressions.
Impressions mainly works depending on how the Instagram algorithm works.
So if one of your posts got too many impressions, it basically depends on what time you posted and which hashtags you used. So try replicating these on other post and see if it works.
Want to learn how to get Instagram algorithm to work FOR YOU? Watch this Instagram algorithm video.
5. Profile Visits.
Figure out what type of content you posted – what value you had provided and what CTA you used that made people to visit your profile.
6. Website Clicks.
Did you use any CTA or any other strategy that worked to get that post get you website clicks from there.
7. Saves.
You also wanna know which type of content gets you most saves! So that you can know what you audience is liking and saving. Saving also means that people wanna share that content! So make sure to check this one.
RECOMMENDED READING:
2. Profile Insights
Now if you go back and click on the “Activity” tab you’ll find a week’s activity – how many interactions, profile visits, website clicks in that week compared to the last week.
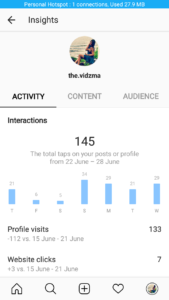
Things to notice here:
1. How many profile visits vs. how many followers in that week.
If the difference is too high, you need to work on creating a good first impression so that you can get more followers.
2. How many website clicks?
This will show you if your CTA in your bio is giving you good results or you need to change it.
3. Audience Insights
Now if you click on the “Audience” tab, you’ll find who is your audience – their age, gender, country and even city they belong to, and followers count.
Which insights to notice:
1. Gender and age group
Knowing this will help you what type of content to post.
For instance, if your audience is mostly men from 18-24 age group, posting sexy pics might work 😉 (Stick to your niche 😑)
Or, if they belong to 25-34 age group, then highly valuable (more importantly, educative) stuff is appreciated by them.
And if they belong to lower 13-17, they must be studying. So entertaining, sarcastic, jokes might work really well.
2. Country
Find the time of that country and then combine it with what type of audience you have to get the best time to post.
For instance, if your audience is young moms – you know that they are free when their kids are at school. So they’ll be on Instagram between 8am-2pm.
Convert this time of that country into your time zone and post at that time.
Voila! Your post received the highest engagement!
3. Followers
Which day and hour got you most followers – also combine this statistic with what you posted on that day to get detailed analytics.
RECOMMENDED READING:
How to leverage Single Instagram Post Statistics
When you go to your post, you can see “View Insights” under your post on the left side.
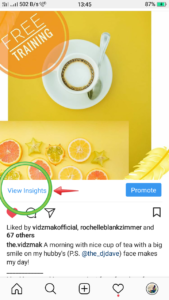
Clicking on this will tell you how many likes, comments and saves that post has got.
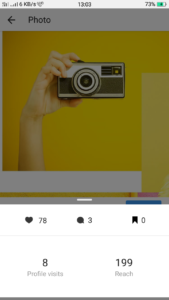
Now, if you slide it upwards, you can see the full insights of that post.
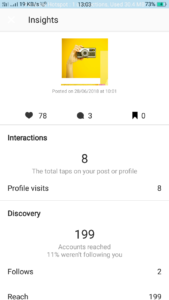
1. Interactions:
This will show you how many people interacted with that post.
Interactions include:
Profile visits
If someone visited your profile after seeing that post.
This will help you to analyze which type of posts are drawing your potential followers to your account. Now after they visit your account, it’s your job to make them follow you. Don’t ask me how, because I’ve already written a post on this here.
Follows
This will tell you how many people followed you after seeing that post.
Champion tip: If you see a lot of people visiting your account but lower number of people actually following you (difference in number of both in statistics), this tells you that you should work on creating a good first impression (seriously, you need to read these – creating first impression, and creating a client magnetic bio)
Website Clicks
How many people clicked on your URL in the bio after visiting that post. If one of your posts got you the most website clicks, then you need to see what kind of pitch, CTA, voice and image you used to drive traffic to your website.
Replicating these factors again will give you the same kind of traffic.
2. Discovery
Discovery shows data on how did your post got discovered.
It includes:
Accounts reached
This is the number of unique accounts reached by your post.
It also shows the percentage of people that viewed your posts that weren’t following you.
Impressions
How many times your post was seen. (This includes the accounts reach number)
Here you can analyze a ratio of how many people saw your post (reach) vs how many likes you gained.
This should concern you especially if you are photographer because your photos need to be eye catching and instantly like-able.
On the other hand, like for me, I can deal with high difference because I am going for a highly educational content which is in my caption so until and unless someone reads my captions they are not going to like my content. (It’s hard for you if you’re not creating good photos but good captions 😅. Hey, I am working on my photos, don’t judge me😒)
Now this is IMPORTANT:
These insights also tell you where did your fellow post viewers saw your posts:
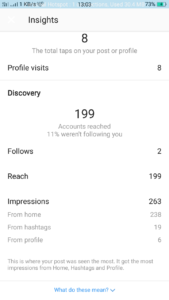
From Home
These are the ones that follow you. So this must be the highest number from all.
From Profile
These are people who are stalking you……..Not essentially😆.
These are the people coming from: you liked or commented on someone’s post and they visited your profile and then your post, or if they searched something and your profile came up, & they visited you. And also, if anyone wanted to see if there are any new posts from you! (So yeah, your stalker)
From hashtags
This is particularly helpful if you want to A-B test your hashtag lists. Try a few different lists and put them in different posts and see which hashtags get you the most impressions!
From explore page
If you went viral! This will show up only in those posts that were seen on other people’s explore page. Want to make that happen? Read how to make an Instagram post go viral on Instagram.
From other
These could be from:
the posts shared through direct message
from posts that were saved
posts that are in the following tab in your notifications
from posts that you are tagged or mentioned in.
The main objective of using analytics is to find out what works with YOUR audience so that you can model those to get a higher engagement in your future posts.
That’s a wrap. Hope you enjoyed this and learned something. If you did, make sure to give back the love by commenting below 😉